
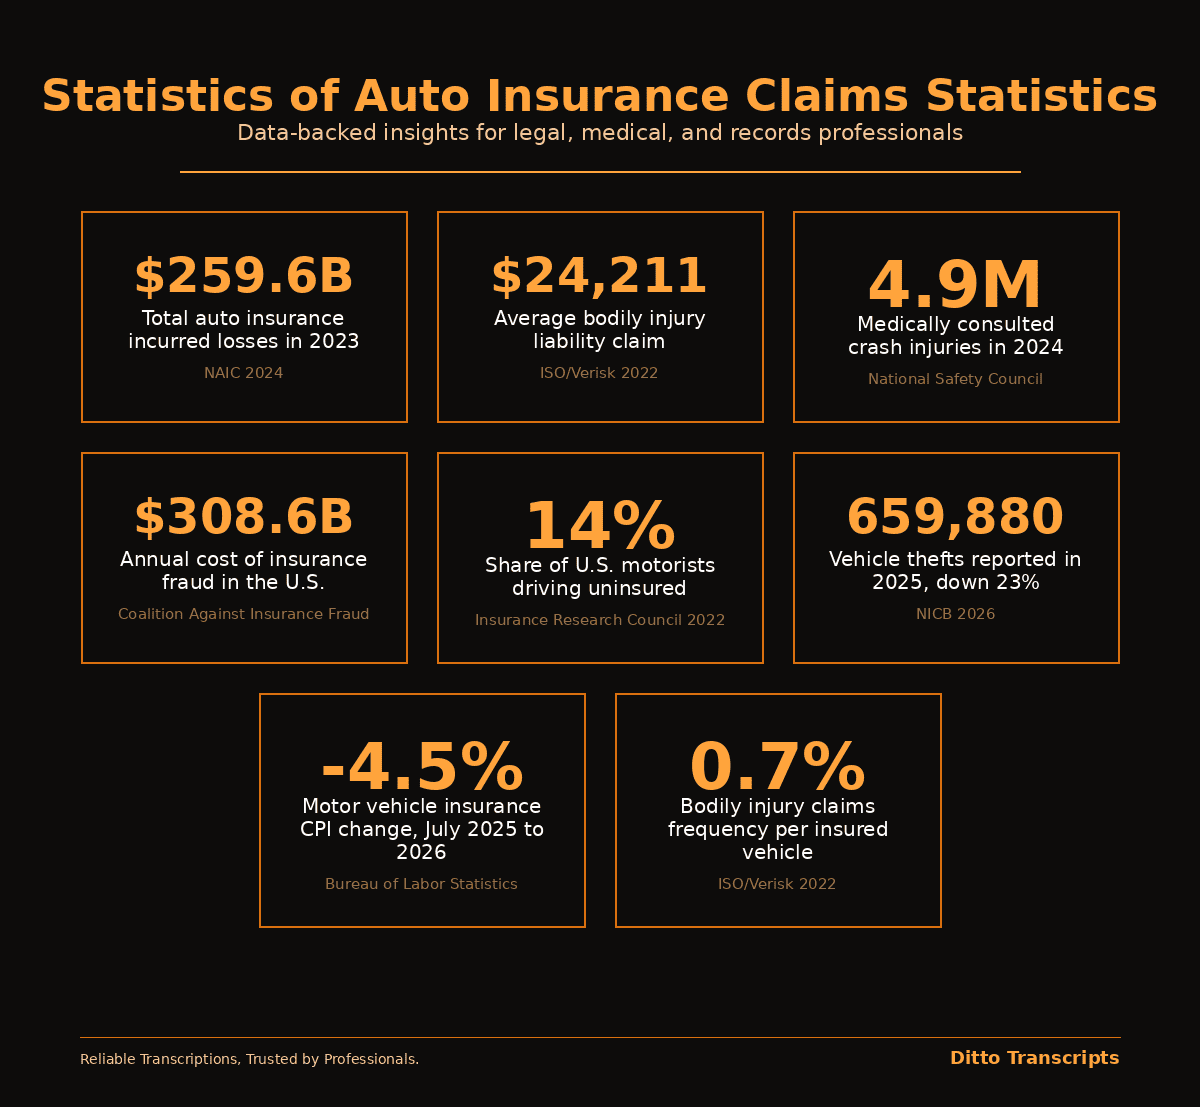
American drivers filed enough auto insurance claims in 2023 to generate $259.6 billion in incurred losses across private passenger and commercial lines, according to the NAIC. That figure climbed 6.8% from the prior year, driven largely by rising bodily injury severity. The average bodily injury liability claim now costs $24,211, more than four times the average property damage payout, based on 2022 data from ISO, a Verisk business. Meanwhile, the National Safety Council reports 4.9 million medically consulted injuries from motor vehicle crashes in 2024. These numbers shape premiums, fraud exposure, and the documentation burden that follows every collision.
Summary: Key Statistics at a Glance
- Total auto insurance incurred losses reached $259.6 billion in 2023, up from $243.0 billion in 2022.
- The average bodily injury liability claim was $24,211 in 2022, while the average collision claim was $5,992.
- Motor vehicle crashes caused 4.9 million medically consulted injuries and 42,789 deaths in 2024.
- The total economic cost of motor vehicle injuries reached $559.3 billion in 2024.
- Bodily injury liability claims occur at a frequency of 0.7% per insured vehicle, compared to 4.9% for collision claims.
- Insurance fraud costs American consumers at least $308.6 billion every year, with fraud present in roughly 10% of property-casualty losses.
- About 14% of U.S. motorists (one in seven drivers) were uninsured in 2022.
- Vehicle thefts dropped to 659,880 in 2025, a 23% decrease from 2024.
- The Consumer Price Index for motor vehicle insurance fell 4.5% from July 2025 to July 2026, the first sustained decline after years of sharp increases.
- Private passenger auto liability losses alone totaled $125.7 billion in 2023.
Claims Frequency and Average Payouts by Coverage Type
Not all auto insurance claims carry equal weight. According to 2022 data from ISO, a Verisk business, collision claims are the most common at 4.9% of insured vehicles filing per year, followed by comprehensive claims at 3.3%, property damage liability at 2.4%, and bodily injury liability at just 0.7%.
The severity gap tells a different story. Average payouts by claim type in 2022 were:
- Bodily injury liability: $24,211
- Collision: $5,992
- Property damage liability: $5,313
- Comprehensive: $2,738
Bodily injury claims are rare by frequency but dominate overall loss dollars. Private passenger auto liability losses (which include both bodily injury and property damage coverage) reached $125.7 billion in 2023, according to the NAIC, compared to $95.4 billion for physical damage coverages. The liability share has grown steadily since 2019, when it stood at $96.2 billion.
Collision severity continues to rise as well. The National Safety Council reports that total motor vehicle injury costs hit $559.3 billion in 2024, a figure that encompasses medical expenses, wage and productivity losses, property damage, administrative costs, and employer costs. With 4.9 million medically consulted injuries in 2024, the per-injury economic burden remains substantial.
Bodily Injury Claims: Medical Records and Recorded Statements
Bodily injury claims represent the highest-cost segment of auto insurance. At $24,211 per claim on average, according to ISO, a Verisk business, they are more than four times the average collision payout and nearly five times the average property damage claim. Despite their low frequency (0.7% of insured vehicles per year), bodily injury claims accounted for the single largest category of incurred losses in 2023.
Several factors drive bodily injury costs. The National Safety Council estimated 42,789 traffic deaths and 4.9 million medically consulted injuries in 2024. Each injury that triggers a bodily injury claim generates a documentation trail: emergency room records, imaging reports, specialist notes, surgical summaries, rehabilitation logs, and recorded statements from claimants and witnesses.
Accuracy in this documentation matters. Medical records serve as the evidentiary foundation for determining injury causation and damages. Recorded statements from drivers, passengers, and eyewitnesses are transcribed and reviewed by adjusters, defense counsel, and plaintiff attorneys throughout the claims lifecycle. Errors or omissions in these transcripts can affect settlement values and litigation outcomes. Insurance carriers and law firms handling high-volume bodily injury caseloads often rely on medical transcription services to convert recorded interviews, independent medical examinations, and peer reviews into accurate written records.
The NHTSA reports that distracted driving alone caused 3,308 fatalities in 2022, with cellphone use identified in 12% of those distraction-related fatal crashes. Speeding was a factor in crashes involving 10,295 drivers (19.1% of all fatal crash drivers), while alcohol or drug impairment affected 6,246 drivers (11.6%). Each of these contributing factors becomes relevant in bodily injury claims, where fault determination directly influences payout size.
Vehicle Theft, Comprehensive Claims, and Fraud
Comprehensive coverage handles non-collision losses such as theft, vandalism, weather damage, and animal strikes. At 3.3% frequency and an average payout of $2,738 (per ISO, a Verisk business 2022 data), comprehensive claims are common and relatively low-cost compared to bodily injury.
Vehicle theft has shown a notable trend reversal. The NICB reports 659,880 vehicles stolen in 2025, a 23% decline from 2024. That followed a 17% drop in 2024, the largest single-year decrease in 40 years. One vehicle was still stolen every 48 seconds in 2025, and California alone accounted for 136,988 thefts (over 20% of the national total). The Hyundai and Kia theft surge that dominated headlines in 2022 and 2023 is subsiding; those manufacturers’ share of total thefts fell from 21% in 2023 to 14% in 2025, following the rollout of theft-prevention software updates.
Insurance fraud remains a larger financial drag on the system. The Coalition Against Insurance Fraud estimates that fraud steals at least $308.6 billion from American consumers annually, with fraud present in about 10% of property-casualty insurance losses. Auto-specific fraud schemes range from staged accidents to inflated repair invoices to misrepresented injury severity.
The fraud landscape is shifting. The NICB projected a 49% rise in insurance fraud linked to identity theft in 2025, based on an analysis of thousands of questionable claims from 2022 through mid-2025. Synthetic identity fraud (where criminals fabricate identities from real and fictitious data) resulted in more than $47 billion in losses in 2024, according to AARP data cited by the NICB. These schemes now serve as the foundation for fraud across auto insurance, life insurance, and healthcare claims.
Uninsured Motorists and the Coverage Gap
The Insurance Research Council estimates that 14.0% of U.S. motorists were uninsured in 2022, roughly one in seven drivers. The uninsured rate rose sharply during the pandemic (from 11.1% in 2019 to 13.9% in 2020) and continued climbing through 2021 (14.2%) before stabilizing slightly in 2022.
Geographic variation is wide. The District of Columbia had the highest uninsured rate at 25.2%, followed by New Mexico (24.9%) and Mississippi (22.2%). Wyoming had the lowest rate at 5.9%, followed by Maine and Idaho at 6.2% each. Nineteen states plus D.C. exceeded the national average, while 31 states remained below it.
Uninsured motorists create a direct cost burden on insured drivers. When an uninsured driver causes an accident, the injured party’s own uninsured/underinsured motorist coverage absorbs the loss. This coverage gap contributes to higher premiums for compliant drivers and complicates the claims process, particularly in states with high uninsured rates.
Emerging Trends and What’s New in 2026
- Premium relief is arriving. After years of relentless rate increases, the Bureau of Labor Statistics shows the Consumer Price Index for motor vehicle insurance fell 4.5% from July 2025 to July 2026. For context, motor vehicle insurance CPI rose 63.8% between 2014 and 2023, including a 17.4% spike in 2023 alone. The 2026 decline signals that insurers’ rate corrections are catching up with loss trends, though premiums remain far above pre-pandemic levels.
- Bodily injury severity keeps climbing. While collision and property damage claim frequency has moderated, bodily injury paid amounts have grown as a share of total claims dollars. Medical inflation, litigation funding, and longer treatment timelines continue to push BI claim costs higher. The gap between the average bodily injury claim ($24,211) and the average collision claim ($5,992) underscores this divergence.
- Vehicle technology is reshaping repair costs. Advanced driver assistance systems (ADAS), including cameras, radar sensors, and lidar units, are now standard on most new vehicles. A minor fender-bender that would have been a simple body repair a decade ago can now require sensor recalibration costing hundreds or thousands of dollars. These technology-related repair costs contribute to rising collision claim severity even as crash frequency improves.
- Identity-driven fraud is the fastest-growing threat. Synthetic identities, fabricated from combinations of real and fake personal data, are enabling fraud at scale across auto, health, and life insurance. The [NICB](https://www.nicb.org/news/news-releases/nicb-projects-49-rise-insurance-fraud-linked-identity-theft-2025) projects identity-linked insurance fraud rose 49% in 2025, and nearly a quarter of questionable claims referred to the NICB involved synthetically generated identities.
- Theft is declining but not disappearing. The 23% drop in vehicle thefts in 2025 is encouraging, but 659,880 stolen vehicles still represents a significant claims volume. The geographic concentration (California alone accounted for over 20% of all thefts) means comprehensive claim patterns vary dramatically by region.
How Ditto Transcripts Helps
Ditto Transcripts helps insurance carriers, adjusters, and defense attorneys manage the documentation demands of bodily injury claims with human-produced transcription of recorded statements, independent medical examinations, and depositions. Every transcript is handled under HIPAA-compliant procedures and reviewed by a human transcriptionist for accuracy. Explore medical transcription services to see how it works.